Summary
Every winter, millions of students, parents, and school administrators anxiously watch the weather—hoping, calculating, and sometimes even praying for a snow day. But what actually happens behind the scenes of a snow day prediction? From atmospheric science and numerical weather modeling to school district decision trees and real-time meteorological data, snow day forecasting is a surprisingly complex, multi-layered process. This article pulls back the curtain on the entire prediction pipeline—covering how meteorologists read the atmosphere, how school officials weigh safety decisions, and how modern digital tools like a Free Snow Day Calculator bring all these variables together for everyday families.
Table of Contents
- Introduction: More Than Just a Weather Guess
- The Atmosphere: Where Snow Day Predictions Begin
- Numerical Weather Prediction: The Science of Forecasting Snowstorms
- Key Meteorological Variables That Drive Snow Day Decisions
- How School Districts Make the Call
- The Role of Local Weather Services and Emergency Management
- How Technology and Algorithms Are Changing the Game
- Why Geography and Regional Climate Matter
- How Parents Can Track a Snow Day Before It’s Official
- Common Myths About Snow Day Predictions
- Conclusion
1. More Than Just a Weather Guess
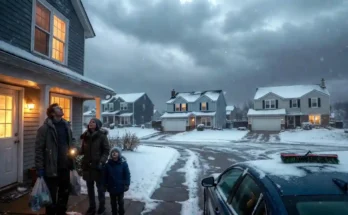
When the forecast calls for a snowstorm, something remarkable happens in the invisible machinery of meteorology, government infrastructure, and school administration. A snow day is never the result of a single person glancing out a window and shrugging. It is the product of days of atmospheric modeling, local data collection, risk analysis, and institutional decision-making — all working in concert to protect students and staff from dangerous winter conditions.
Understanding the science and logistics behind snow day predictions doesn’t just satisfy curiosity. It helps parents plan ahead, helps students recognize the real Signs a Snow Day Is Coming Tomorrow, and helps communities appreciate the level of care that goes into these seemingly simple calls.
Let’s go deep into the process — from the upper atmosphere to the superintendent’s phone call.
2. The Atmosphere: Where Snow Day Predictions Begin
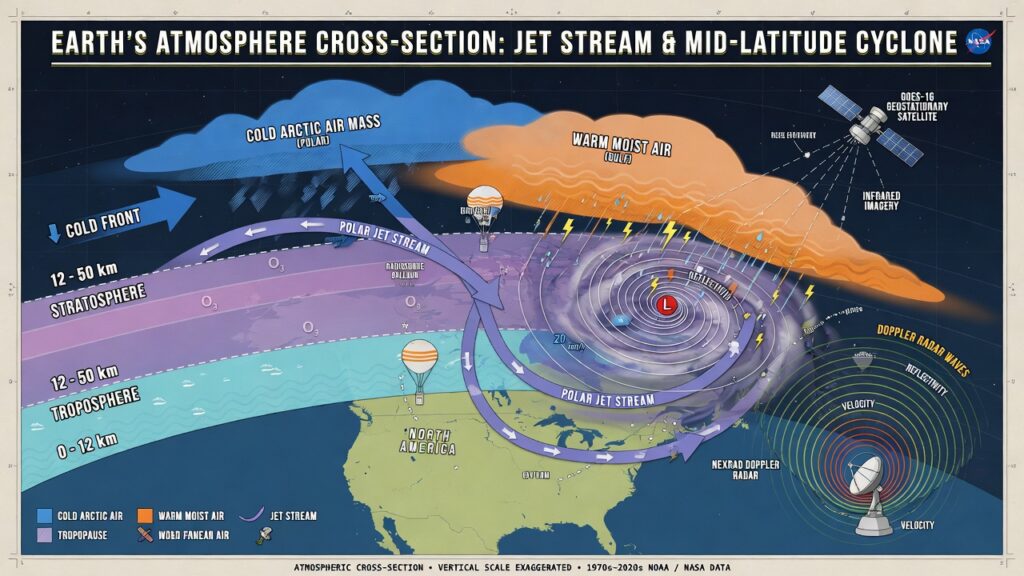
Every snow day begins tens of thousands of feet in the sky. The troposphere — the lowest layer of Earth’s atmosphere — is where all weather events, including blizzards, nor’easters, and lake-effect snow events, take shape.
Several large-scale atmospheric systems drive winter precipitation:
- Arctic air masses — Cold, dense bodies of air that descend from polar regions, often guided southward by shifts in the polar vortex
- The jet stream — A fast-moving ribbon of wind at high altitude that steers storm systems across the continent
- Moisture convergence zones — Areas where warm, humid air meets cold air, triggering condensation and snowfall
- High and low pressure systems — Low-pressure systems draw in moisture and create lift, while high-pressure systems tend to bring clear, cold conditions
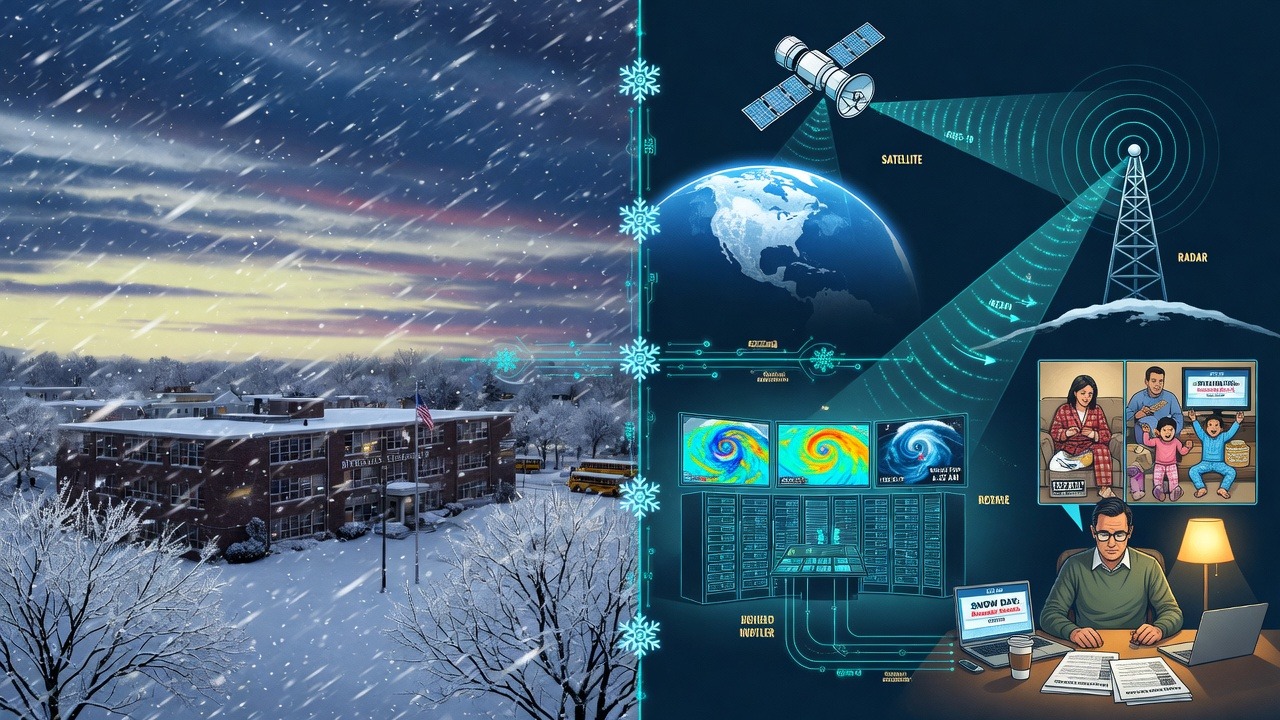
Meteorologists study the behavior of these systems using an expansive global network of radiosonde weather balloons, polar-orbiting satellites, geostationary satellites, and surface observation stations (ASOS — Automated Surface Observing Systems). The data gathered from these instruments feeds into the massive computational models that form the backbone of modern weather forecasting.
3. Numerical Weather Prediction: The Science of Forecasting Snowstorms

The engine behind any snow day prediction is Numerical Weather Prediction (NWP) — a method of forecasting that uses mathematical models of the atmosphere, initialized with current observational data, to simulate how weather patterns will evolve over time.
The Major Weather Models Used in Snow Forecasting
The National Weather Service (NWS) and meteorologists worldwide rely on several key models:
- GFS (Global Forecast System) — The American model, run four times daily, producing forecasts up to 16 days. It covers the entire globe at a resolution of about 13 kilometers.
- ECMWF (European Centre for Medium-Range Weather Forecasts) — Often called the “Euro model,” widely considered the most accurate global model in the world for medium-range forecasts.
- NAM (North American Mesoscale Model) — A higher-resolution model focused on North America, excellent for capturing mesoscale features like lake-effect snow bands.
- HRRR (High-Resolution Rapid Refresh) — A cutting-edge model updated every hour, providing 18-hour forecasts at 3 km resolution. This is critical for day-of forecasting precision.
- RAP (Rapid Refresh) — Similar to HRRR but at slightly lower resolution, covering short-range forecasts frequently updated throughout the day.
Each of these models ingests terabytes of real-time observational data — including temperature, humidity, wind speed, pressure, and cloud cover readings from thousands of stations — and runs complex equations based on atmospheric dynamics, thermodynamics, and fluid mechanics to project the future state of the atmosphere.
Ensemble Forecasting: Accounting for Uncertainty
No single model run is perfect. That’s why forecasters use ensemble modeling — running the same model dozens of times with slightly varied initial conditions to produce a range of possible outcomes. The spread of the ensemble tells meteorologists how confident they should be. A tight ensemble cluster means high confidence; a wide spread signals significant uncertainty in the forecast.
The GEFS (Global Ensemble Forecast System) and SREF (Short-Range Ensemble Forecast) are two tools forecasters use to communicate probability — for example, a 70% chance of 6+ inches of snow is the result of multiple ensemble members agreeing on that outcome.
According to the National Oceanic and Atmospheric Administration (NOAA), modern weather models have made 3-day forecasts as accurate as 1-day forecasts were just two decades ago — a testament to advances in computing power and data assimilation.
4. Key Meteorological Variables That Drive Snow Day Decisions
Not all snowfall is created equal. A snow day prediction isn’t simply about whether snow will fall — it’s about whether the type, amount, timing, and accompanying conditions will make roads, sidewalks, and school grounds unsafe.
Snowfall Accumulation Thresholds
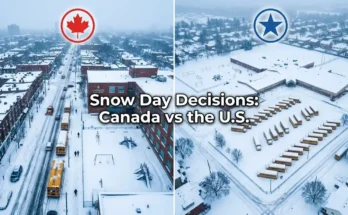
Different school districts operate with different snowfall thresholds based on their geography and infrastructure. In northern states like Minnesota or Michigan, 3–4 inches of snow may not trigger a closure. In southern states like Georgia or Tennessee, even 1–2 inches can paralyze transportation systems. This is precisely why Some States Get More Snow Days Than Others — it’s not just about snowfall totals but about how prepared the region is to handle it.
Key accumulation measurements include:
- Total expected accumulation (in inches or centimeters)
- Snowfall rate (inches per hour) — heavy, rapid snowfall is more disruptive than light, slow accumulation
- Snow water equivalent (SWE) — measures the liquid water content in snow; wet, heavy snow is more dangerous than fluffy powder
- Snow-to-liquid ratio (SLR) — determines the density and drifting potential of snow
Temperature and Wind Chill
Temperature is equally critical. Freezing rain and ice storms — which occur when precipitation falls as liquid rain through a thin layer of above-freezing air before hitting a surface below 32°F (0°C) — are often more dangerous than heavy snowfall because they create black ice, the most treacherous road condition.
Wind chill is also factored in for student safety — exposed skin can suffer frostbite in a matter of minutes at extreme wind chill values, raising concern about children waiting at bus stops.
Timing of Precipitation
Perhaps the most overlooked variable is when snow falls. A storm that dumps 8 inches overnight, allowing road crews to plow before the school day, may result in no closure. The same storm delivering 8 inches between 6:00 AM and 9:00 AM — during bus pickup windows — almost certainly triggers a closure. Meteorologists must therefore provide not just accumulation totals but accurate onset, peak, and ending times to help administrators make their calls.
5. How School Districts Make the Call
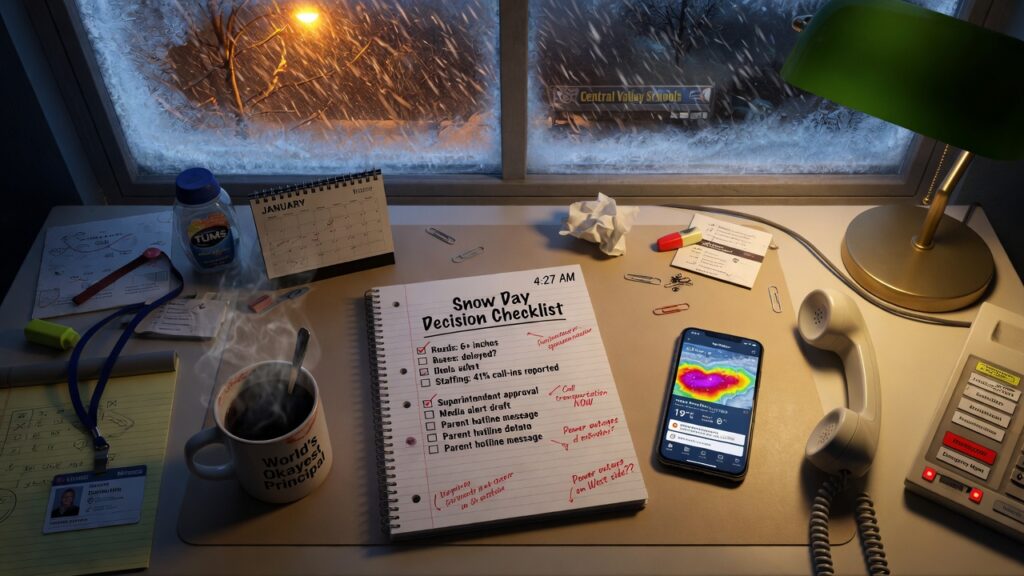
The Decision-Making Timeline
Most snow day decisions happen in a narrow window of time — typically between 4:00 AM and 6:00 AM on the day in question, though monitoring begins 48–72 hours in advance. Here’s a typical timeline:
| The decision may be made early if the forecast is of high confidence | Activity |
| 72 hours before | Meteorologists begin flagging winter storm potential |
| 48 hours before | School leadership monitors NWS watches and advisories |
| 24 hours before | Superintendent consults transportation directors and facilities teams |
| 6:00 PM (evening before) | Decision may be made early if forecast is high confidence |
| 4:00–5:30 AM (day of) | Final decision based on updated model runs and road reports |
| 5:30–6:00 AM | Automated calls, social media, and media station alerts sent |
Who Has the Final Say?
The school superintendent holds the ultimate authority over snow day decisions, but they rely on input from multiple stakeholders:
- Transportation Directors — Who assess bus route safety and assess whether buses can safely navigate hills and back roads
- Facilities Managers — Who report on parking lot and sidewalk conditions
- Local Police and Public Works Departments — Who provide real-time road condition updates
- National Weather Service local forecast offices — Who issue Winter Storm Watches, Warnings, and Advisories that carry official weight
- County Emergency Management Agencies — Who may declare travel advisories or states of emergency
The decision is rarely made by one person alone — it is a collaborative risk management process with student safety as the paramount concern.
6. The Role of Local Weather Services and Emergency Management
The National Weather Service operates 122 local forecast offices across the United States, each staffed by trained meteorologists who produce hyper-local winter weather forecasts tailored to specific counties, elevations, and microclimates. When a significant winter storm is approaching, these offices issue:
- Winter Storm Watch — Conditions are favorable for a significant storm in 48–72 hours
- Winter Weather Advisory — Hazardous winter weather expected; travel is difficult
- Winter Storm Warning — Dangerous conditions imminent; travel is dangerous or impossible
- Ice Storm Warning — Significant ice accumulation expected
- Blizzard Warning — Winds ≥35 mph with snow reducing visibility to ¼ mile or less for 3+ consecutive hours
These official NWS products are directly used by school administrators as legal and logistical benchmarks for closure decisions. Many districts have explicit policies — for example, automatically closing when a Winter Storm Warning is issued for their county — removing ambiguity from the process.
7. How Technology and Algorithms Are Changing the Game
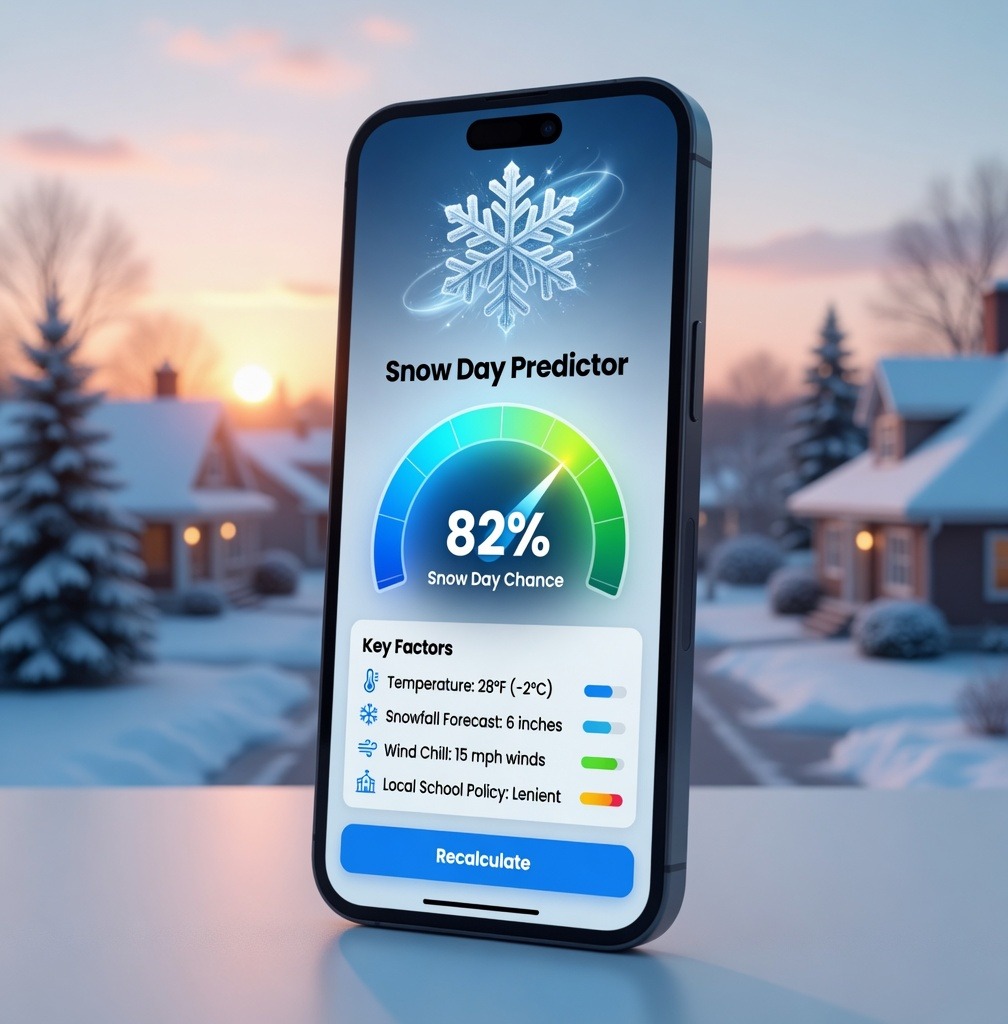
The democratization of weather data has enabled a new generation of algorithmic snow day prediction tools that synthesize meteorological inputs into a single, user-friendly probability score. These platforms pull from:
- Live NWS forecast data APIs
- NOAA weather model outputs
- Historical snow day decision patterns by district
- Real-time road condition databases
- Geographic and elevation data
A Free Snow Day Calculator can process all of these inputs against a school district’s historical closure patterns to give parents and students an accurate, data-driven probability estimate — often 24–48 hours before the official announcement.
Machine learning is also beginning to play a role in snow day prediction. By training models on years of historical closure data alongside corresponding weather conditions, researchers can identify patterns that standard meteorological forecasting misses — like the fact that a particular rural district with many unpaved roads tends to close at lower snowfall thresholds than its urban neighbor.
8. Why Geography and Regional Climate Matter
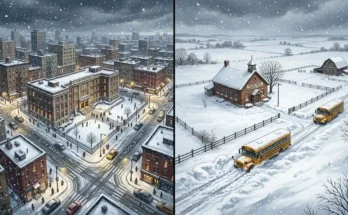
Snow day prediction is deeply contextual and geographic. The same storm that shuts down Washington, D.C., might not even delay school in Cleveland, Ohio. Several geographic factors influence the prediction process:
- Elevation — Mountainous areas receive more snow than valley floors; school districts spanning both must predict conditions across elevation gradients
- Proximity to large water bodies — The Great Lakes generate intense, localized lake-effect snow bands that standard models sometimes underestimate
- Urban heat islands — Cities tend to be 2–5°F warmer than surrounding rural areas, meaning urban schools may see rain while rural counterparts get snow
- Road infrastructure — Regions with robust snowplow fleets and pre-treatment programs (brine/salt) can handle more accumulation before closures become necessary
- Community experience with winter weather — Northern communities have cultural and institutional snow management muscle memory; southern communities do not
All of these factors mean that no universal snow day formula exists — every district must be understood on its own terms.
9. How Parents Can Track a Snow Day Before It’s Official
Families don’t have to wait passively for 6 AM robocalls. Here’s how savvy parents track snow day likelihood in real time:
- Monitor NWS alerts — Check weather.gov for your county’s active watches, warnings, and advisories
- Watch the HRRR model — Updated hourly, this high-resolution model gives the most current picture of storm evolution
- Check local road conditions — State DOT websites and apps like Waze provide real-time road reports
- Follow your district’s social media — Many superintendents now post updates on Twitter/X or Facebook the evening before
- Use a snow day prediction tool — A Free Snow Day Calculator translates all the weather complexity into a single, easy-to-read probability
- Know your district’s thresholds — Understanding your district’s historical closure patterns helps you calibrate your own expectations
10. Common Myths About Snow Day Predictions
Myth #1: “The forecast says 3 inches — that’s definitely a snow day.” Reality: Accumulation alone doesn’t determine closures. Timing, temperature, road conditions, and regional norms all matter equally.
Myth #2: “If it snows overnight, school will be closed.” Reality: Overnight snow gives road crews time to plow and treat roads. A well-prepared district may open on time after a significant overnight snowfall.
Myth #3: “Flushing ice cubes down the toilet makes a snow day more likely.” Reality: Charming folklore, but meteorologically irrelevant. Snow days are determined by atmospheric science, not superstition.
Myth #4: “My school always closes at 4 inches.” Reality: Most districts don’t publish rigid numerical thresholds; decisions are holistic and situational.
Myth #5: “Weather apps are always right.” Reality: Consumer weather apps often use lower-resolution model data. Professional meteorological tools and ensemble guidance offer greater precision for critical decisions.
Conclusion
A snow day prediction is one of the most intricate, multi-disciplinary decisions in public education. It begins in the upper atmosphere, moves through supercomputers processing petabytes of satellite and balloon data, flows through a network of meteorologists, emergency managers, transportation directors, and superintendents, and finally lands on your phone as a robocall at 5:45 AM.
Understanding this pipeline doesn’t diminish the magic of a snow day — it deepens it. Every school closure is a triumph of science, infrastructure, and community care over the raw power of winter weather. And with modern tools putting this data at everyone’s fingertips, the days of pure guesswork are behind us.
Whether you’re a student crossing your fingers, a parent planning your day, or simply someone fascinated by the intersection of meteorology and public life, now you know exactly what happens behind the scenes.