Summary
Snow days are a beloved — and sometimes dreaded — part of American life, but they are far from equally distributed across the country. While children in Buffalo, New York, might celebrate a dozen or more school cancellations each winter, students in Atlanta, Georgia, rarely see even one. This article Why Some States Get More Snow Days dives deep into the geographic, meteorological, and policy-driven factors that determine why some U.S. states consistently rack up far more snow days than others. From lake-effect snowstorms and Arctic air masses to elevation, latitude, school district policies, and infrastructure readiness, we unpack the full picture behind winter school closures. Whether you’re a parent planning your winter, a student watching the forecast, or simply curious about the science of snow, this guide gives you everything you need to understand the snowbelt difference — and how to use a Snow Day Calculator to stay one step ahead of the forecast.
Table of Contents
- Why Snow Days Vary So Much Across the U.S.
- The Role of Geography and Latitude
- How Weather Patterns Drive Regional Snowfall
- Lake-Effect Snow: The Great Lakes Factor
- Elevation and Mountain States
- Urban Heat Islands and Snow Day Frequency
- How School Districts Decide to Cancel School
- Infrastructure and Snow Removal Preparedness
- The States That Get the Most Snow Days
- The States That Get the Fewest Snow Days
- Climate Change and the Future of Snow Days
- How to Predict Snow Days Before They’re Announced
- Conclusion
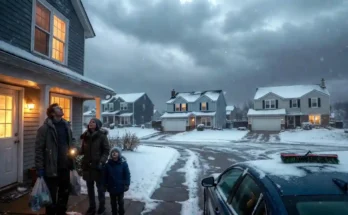
Snow days are one of the most unpredictable, exciting — and for school administrators, nerve-wracking — events of the academic year. But if you’ve ever noticed that your cousin in Cleveland seems to get three times as many snow days as your friend in Charlotte, you’re not imagining things. The disparity is real, measurable, and rooted in a complex interplay of climate science, regional geography, local policy, and municipal preparedness.
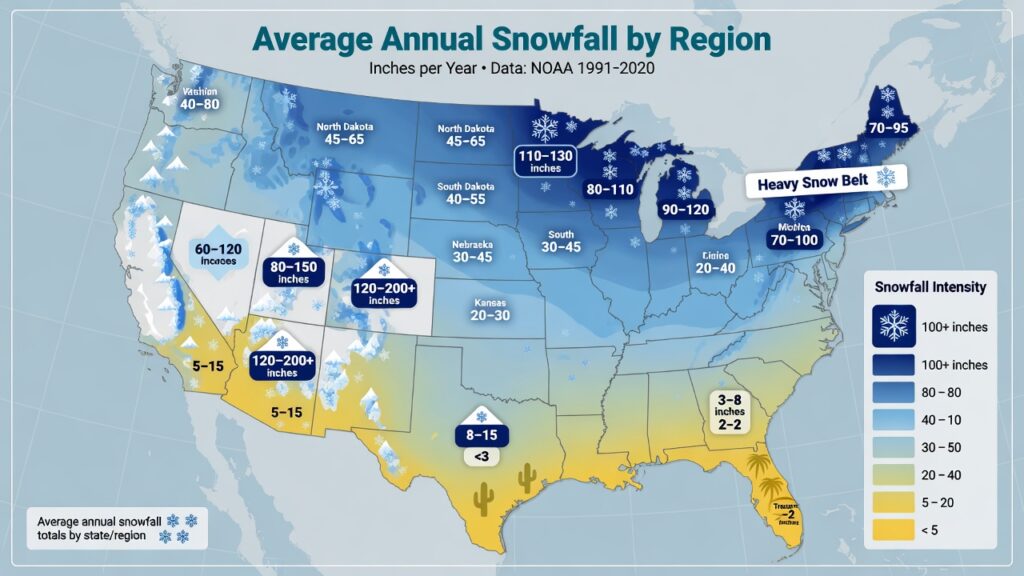
In the United States, average annual snowfall ranges from virtually zero inches in states like Florida and Hawaii to well over 100 inches per year in parts of New York, Michigan, Colorado, and Utah. This enormous variation means that school districts in some states build 15–20 snow day buffer days into their academic calendar, while districts in others never schedule a single one.
Understanding why this happens requires looking at meteorology, topography, municipal infrastructure, and even the socioeconomic realities of different communities. Let’s break it all down.
The Role of Geography and Latitude
The single most fundamental factor in snow day frequency is latitude — how far north or south a state sits on the globe. States located in the northern tier of the continental United States receive dramatically more cold air intrusions from Canada and the Arctic, which are the primary fuel for winter storms.
Latitude and the Polar Jet Stream
The polar jet stream — a fast-moving river of air in the upper atmosphere — acts as the boundary between frigid Arctic air to the north and warmer air to the south. During winter, the jet stream dips southward in a pattern called a Rossby wave, allowing Arctic air masses to plunge deep into the continental United States. States like Minnesota, Wisconsin, Michigan, New York, Vermont, and Maine sit in the path of these intrusions far more often than states in the Deep South.
The further north a state sits, the more exposure it has to:
- Continental polar (cP) air masses originating over Canada
- Arctic (A) air masses from the high Arctic
- Cold fronts that carry moisture-laden air across the Great Lakes and Atlantic Coast
States below the 35th parallel — roughly the latitude of Memphis, Tennessee, and Albuquerque, New Mexico — experience cold air intrusions infrequently, meaning the conditions needed for significant snowfall rarely align.
Proximity to Moisture Sources
Latitude alone doesn’t explain everything. A state must also have access to atmospheric moisture for snowfall to occur. This is why states like North Dakota and Montana, despite their extreme northern latitude, often receive less snow than states near the Great Lakes or Atlantic Coast. Cold, dry continental interiors produce less precipitation of any kind, while proximity to large water bodies dramatically boosts snowfall totals.
How Weather Patterns Drive Regional Snowfall
Different regions of the United States are affected by distinct synoptic-scale weather systems — large storm patterns that recur seasonally and create predictable snowfall patterns.
Nor’easters and the Atlantic Coast Snowbelt
The Nor’easter is one of the most powerful and impactful winter storm types in the Eastern United States. These storms develop along the Atlantic Coast, often off the Carolinas or in the Gulf of Mexico, and then travel northeastward while intensifying rapidly — a process meteorologists call bombogenesis or “bomb cyclone” development.
Nor’easters are responsible for some of the most historic blizzards in American history, dumping feet of snow on states like Massachusetts, Connecticut, Rhode Island, New Jersey, New York, and Pennsylvania. A single well-developed Nor’easter can result in multiple consecutive snow days for millions of students across the Northeast.
Alberta Clippers and the Great Plains
The Alberta Clipper is a fast-moving, often low-precipitation storm system that originates in the Canadian province of Alberta and sweeps quickly across the Great Plains and Upper Midwest. While these storms don’t always produce the massive snowfall totals of Nor’easters, they bring extreme cold and light, wind-driven snow that can create dangerous whiteout conditions — enough to close schools across Iowa, Illinois, Indiana, Ohio, and Nebraska.
Pacific Systems and the Pacific Northwest
In the Pacific Northwest — Washington and Oregon — winter precipitation is heavily influenced by Pacific moisture streams that arrive off the ocean. However, much of this precipitation falls as rain at lower elevations and snow only at higher elevations, which is why Seattle and Portland have relatively few snow days despite significant winter precipitation totals. When cold Arctic air descends during a Pacific storm, it creates the rare but disruptive ice and snow events that paralyze these cities.
Lake-Effect Snow: The Great Lakes Factor
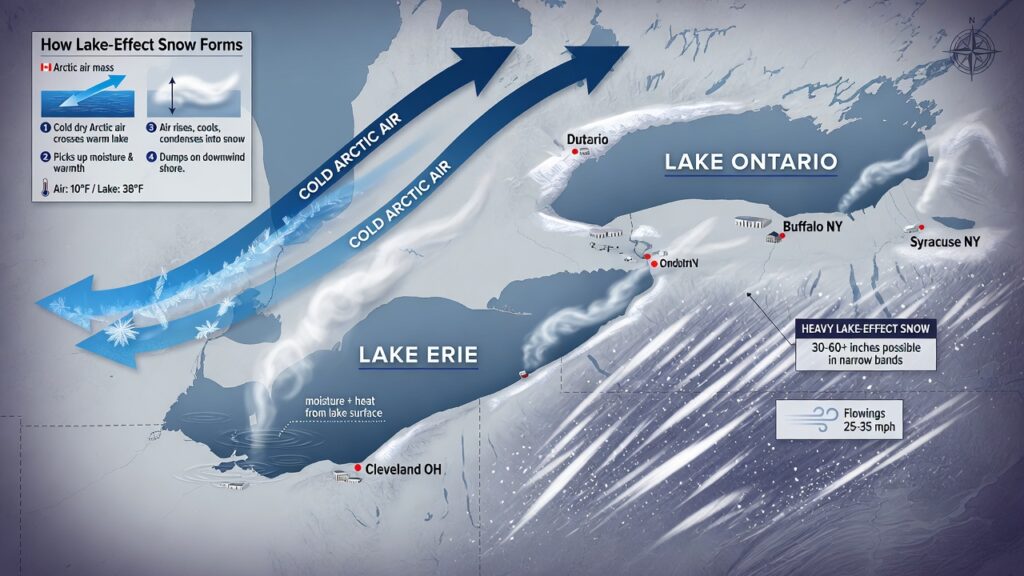
Perhaps no single weather phenomenon explains regional snow day disparities more dramatically than lake-effect snow. This uniquely powerful weather event occurs when cold Arctic air masses — typically originating in Canada — sweep across the relatively warmer open waters of the Great Lakes, picking up enormous amounts of heat and moisture before dumping that moisture as extremely heavy, localized snowfall on the downwind shores.
The Lake-Effect Snow Corridor
The primary lake-effect snow regions in the United States include:
- Western and Southern Lake Erie Shore: Cities like Buffalo, New York, are legendary for lake-effect snow, with annual totals sometimes exceeding 100 inches and individual storm events delivering 3–5 feet of snow within 24–48 hours.
- Southern and Eastern Lake Ontario Shore: The Tug Hill Plateau of New York State and the Syracuse metro area receive some of the heaviest snowfall in the eastern United States, with average annual snowfall of 160–200+ inches in the Tug Hill region.
- Eastern Shores of Lake Michigan: Cities like South Bend, Indiana, and communities in western Michigan are heavily impacted, with South Bend frequently ranking among the snowiest cities in America.
- South of Lake Superior: The Upper Peninsula of Michigan receives staggering snowfall totals, with communities like Houghton, Michigan, averaging over 200 inches of snow annually.
Lake-effect events are particularly disruptive for school districts because they are highly localized — one school district might receive 30 inches of snow while a district just 30 miles away gets only 2 inches — making weather prediction and school closure decisions extremely challenging. If you want to track the probability of a closure in your district, tools like the Snow Day Calculator can help you assess the risk using real-time forecast data.
Elevation and Mountain States
While latitude and proximity to large water bodies are the dominant factors for most states, elevation is the overriding factor for interior western states. Temperature decreases at a rate of approximately 3.5°F per 1,000 feet of elevation gain (a phenomenon known as the environmental lapse rate), which means communities at high altitude experience winter conditions that would be impossible at sea level.
Colorado, Utah, and the Rocky Mountain Snowpack
Colorado and Utah are among the snowiest states in the nation, driven primarily by their high elevation. Denver, sitting at 5,280 feet (the famous “Mile High City”), receives an average of 53 inches of snow annually. Mountain communities within these states receive far more — Steamboat Springs, Colorado, averages over 160 inches, and some Utah ski resorts surpass 500 inches in extraordinary years.
School districts in mountain communities of Colorado, Wyoming, Idaho, Montana, Utah, and New Mexico frequently experience snow days throughout the extended winter season, which can stretch from October through April at higher elevations.
The Cascade Range and Sierra Nevada
In California, Nevada, Oregon, and Washington, the major mountain ranges create a dramatic rain shadow effect. Western slopes receive massive snowfall (the Sierra Nevada averages 300–500 inches in its highest zones), while the eastern side remains relatively dry. School districts in the Eastern Sierra and Cascades experience significant snow days, while those in coastal cities and the Central Valley rarely see any.
Urban Heat Islands and Snow Day Frequency
A fascinating but often overlooked factor in snow day frequency is the urban heat island (UHI) effect. Large metropolitan areas generate significant amounts of heat from vehicle traffic, heating systems, industrial activity, and pavement, raising local temperatures by 2–8°F compared to surrounding rural areas.
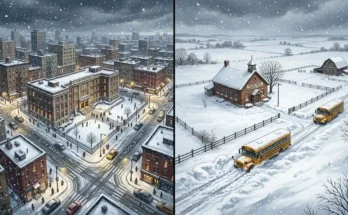
This temperature difference can be enough to determine whether precipitation falls as snow or rain in borderline temperature situations. Cities like Washington, D.C., Philadelphia, and Chicago often experience rain or mixed precipitation, while suburban and rural school districts just miles away receive several inches of snow. This means urban school districts frequently cancel fewer snow days than their suburban counterparts within the same region, even during the same storm event.
How School Districts Decide to Cancel School
Even with identical weather conditions, two school districts in different states may make completely opposite decisions about cancellation. This is because snow day decisions are profoundly shaped by local experience, institutional preparedness, and community expectations.
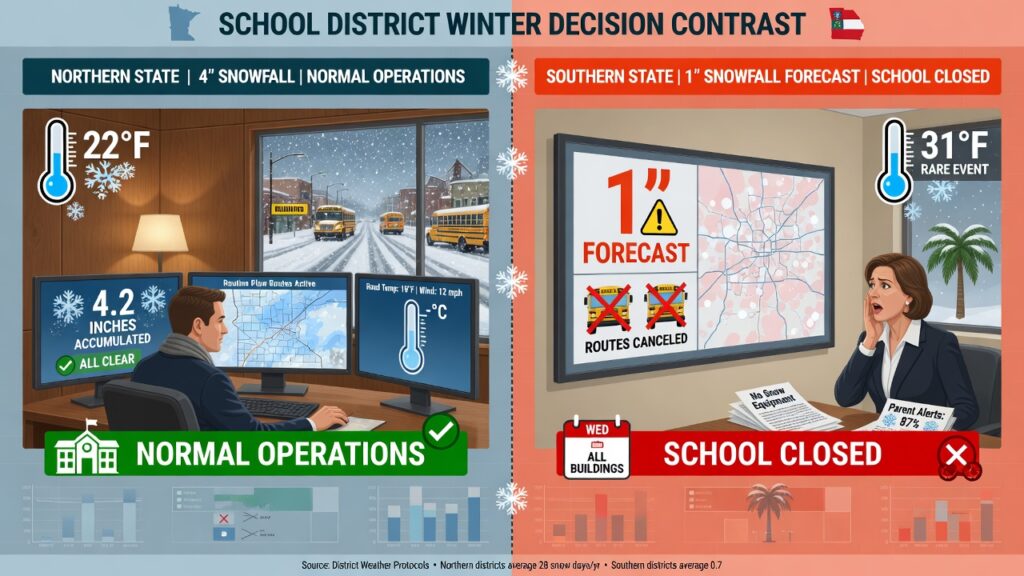
The Low-Snow-State Paradox: 1 Inch Closes Everything
One of the most striking differences in snow day culture is how southern states respond to minimal snowfall. An inch of snow or a coating of ice can shut down an entire metropolitan area in Georgia, North Carolina, or Tennessee — and this is not simply because southerners are unprepared or overreactive. There are rational structural reasons:
- Limited snowplow fleets: A city like Atlanta might have only a handful of snowplows and salt trucks for a metro area of 6 million people. Buffalo, New York, has hundreds.
- Untreated road infrastructure: Roads in the South are not designed or pre-treated for winter weather. Black ice on untreated overpasses and bridges is genuinely life-threatening.
- Inexperienced drivers: Driving in snow and ice is a learned skill. Populations that rarely encounter winter road conditions are statistically more likely to have accidents.
- Low driver experience with tire choices: Few southern drivers use winter tires, which dramatically improves traction in frozen conditions.
The Northern State Standard: Normalizing Heavy Snowfall
In contrast, school districts in Minnesota, Michigan, Wisconsin, and upstate New York routinely operate during conditions that would close entire cities elsewhere. It’s common for these districts to require 12+ inches of snow or extreme wind chills (below -20°F wind chill) before canceling school. The reasons include:
- Robust snow removal infrastructure that can clear roads within hours of a storm
- Experienced drivers who are comfortable in winter conditions
- Widespread use of winter tires and four-wheel-drive vehicles
- School calendars that already account for potential closures with built-in make-up days
Watch for the Signs a Snow Day Is Coming Tomorrow to know when your district is likely to call off school before the official announcement.
Infrastructure and Snow Removal Preparedness
A state’s snow removal infrastructure is arguably the single most controllable factor in snow day frequency. Two states receiving identical snowfall can have wildly different outcomes depending on whether their municipalities have invested in pretreatment programs, snowplow fleets, salt supplies, sand reserves, and trained road crews.
Pre-Salting and Brine Application
Modern highway departments in snow-prone states have shifted toward pre-treating roads with liquid brine before a storm begins, which prevents the initial bond between ice and pavement and dramatically reduces the amount of plowing required. States like Iowa, Ohio, Michigan, and New York have sophisticated brine programs that help keep major roads clear during moderate events — reducing school closures that would otherwise be necessary.
States without these programs often face rapid deterioration of road conditions even in minor storm events.
School Bus Fleet Readiness
For school districts, the condition and capability of the school bus fleet during winter weather is a critical factor. Buses are large, heavy, and can be difficult to control on icy roads. Districts in snowy states equip their buses with snow chains, upgraded tires, and improved deicing systems, while districts in southern states may have no such equipment at all, making even minor icing dangerous for student transportation.
The States That Get the Most Snow Days
Based on NOAA snowfall data, National Weather Service records, and school district historical data, the following states consistently lead the nation in snow days per academic year:
1. Michigan — Lake-effect snow from all five Great Lakes, an extended winter season (October–April), and significant elevation variation in the Upper Peninsula create a perfect storm of snow day frequency. Many UP districts build 20+ snow days into their calendar.
2. New York — Driven by powerful Nor’easters and intense lake-effect snow off Lakes Erie and Ontario, New York districts in the western and northern regions of the state experience some of the highest annual snowfall totals in the nation.
3. Minnesota — Extreme continental cold and regular Alberta Clipper events mean that Minnesota students frequently face school cancellations due to extreme wind chills, even when snowfall totals are moderate. Temperature-based closures (not just snow depth) are common.
4. Vermont and Maine — These New England states combine northern latitude with complex terrain that enhances orographic precipitation, producing deep, consistent snowpack throughout winter.
5. Colorado — Mountain districts in Colorado deal with heavy snowfall and rapidly changing mountain weather, while even front-range communities near Denver can experience rapid-onset blizzards that close schools across the metro.
6. Ohio and Indiana — Heavily impacted by lake-effect snow from Lake Erie (Ohio) and Lake Michigan (Indiana), these states — particularly their northern counties — experience significantly more snow days than their southern neighbors just a few hours away.
The States That Get the Fewest Snow Days
At the other end of the spectrum, many U.S. states rarely, if ever, experience snow days. These include:
- Florida — The only U.S. state never to have recorded a statewide school closure for snow. The closest regions to potential cold events are the panhandle counties, but even these rarely see accumulating snowfall.
- Hawaii — Snow exists only at the summit of Mauna Kea (13,796 ft), and school cancellations are functionally nonexistent.
- Louisiana — Occasional winter storms can dust communities in northern Louisiana with light snow, but significant accumulation is rare enough to be newsworthy.
- Georgia and South Carolina — Despite the drama of their rare snow events, accumulating snow occurs only a few times per decade in most of these states.
- Arizona and Nevada — Low-elevation desert communities in Phoenix and Las Vegas essentially never see snow, while higher-elevation communities in these states can receive significant winter precipitation.
Climate Change and the Future of Snow Days
One of the most actively researched questions in climate science is how anthropogenic climate change will affect winter precipitation patterns across the United States. According to the National Oceanic and Atmospheric Administration (NOAA) and peer-reviewed research published in journals including Nature Climate Change and the Bulletin of the American Meteorological Society, the picture is complex:
- Overall warming trends are reducing the average number of days with snow cover across most of the lower 48 states.
- Lake-effect snow may actually increase in the near term as the Great Lakes remain unfrozen longer into the winter, providing more moisture for lake-effect events.
- Atmospheric moisture loading — the increased capacity of warmer air to hold water vapor — means that when temperatures do align for snowfall, storms may produce more intense snowfall in a shorter period.
- Earlier springs and later autumns are shortening the snow season in many regions, particularly in the mid-Atlantic and lower Midwest.
For a comprehensive analysis of how observed snowfall trends are changing across the United States, the NOAA National Centers for Environmental Information provides publicly accessible climate monitoring data updated monthly with state-level snowfall statistics.
The net effect over the coming decades is likely to be fewer total snow days in most states but with the potential for more extreme, high-impact single storm events — a pattern that makes accurate snow day prediction more important than ever.
How to Predict Snow Days Before They’re Announced

In the age of advanced meteorology and real-time data, waiting for the 6 AM phone call or scrolling through social media is no longer the only way to know if school is canceled. Modern snow day prediction tools synthesize multiple data sources — including NWS forecast data, historical district behavior, local temperature readings, and precipitation intensity models — to generate probability estimates hours or even days in advance.
What Factors Do Prediction Models Consider?
Effective snow day prediction requires evaluating:
- Total forecasted accumulation (in inches) for the specific school district
- Timing of the storm relative to the school day and morning rush
- Temperature at road level, not just air temperature
- Wind speed and chill factor (extreme cold alone can trigger closures)
- Road surface conditions and pre-treatment history
- Historical district behavior during similar events
- Rainfall versus snowfall transition (freezing rain is often more disruptive than pure snow)
Using a dedicated Snow Day Calculator that integrates real-time weather forecast data with local school district history gives families and students their best chance of accurately predicting closures well before the official announcement.
Conclusion
The question of why some states get more snow days than others doesn’t have a single, simple answer — it’s the product of meteorological forces, geographic realities, policy decisions, and infrastructure investments working together in complex, overlapping ways. Buffalo gets more snow days than Birmingham because of lake-effect precipitation, robust storm infrastructure, and an administrative culture built around winter weather management. Atlanta closes schools for a dusting because it lacks the plows, the salt, and the experience to safely operate during any icy conditions.
Understanding these dynamics doesn’t just satisfy curiosity — it helps families plan their winters, school administrators make better closure decisions, and communities advocate for the infrastructure improvements that could keep schools open more safely and consistently. The gap between the snowbelt and the sunbelt in terms of snow day frequency will remain wide for the foreseeable future, though climate change may gradually reshape the map over the coming decades.
Until then, whether you’re in Syracuse or Savannah, knowing the science behind snow days — and using the right tools to predict them — gives you a meaningful edge every winter season.