Summary
Learning How to Read a Weather Map for Snow Day Clues can help parents, students, and teachers understand when winter weather may lead to school delays, early dismissals, or closures. A weather map is more than a colorful forecast graphic; it shows pressure systems, storm tracks, fronts, temperatures, precipitation zones, wind direction, and timing. When you know what those symbols mean, you can spot early signs of snow, ice, freezing rain, and travel hazards before a school district makes the final call.
Table of Contents
- Why Weather Maps Matter Before a Possible Snow Day
- How to Read a Weather Map for Snow Day Clues Step by Step
- Understanding High and Low Pressure Systems
- Reading Cold Fronts, Warm Fronts, and Stationary Fronts
- How to Read a Weather Map for Snow Day Clues Using Snow Bands
- Temperature, Dew Point, and Freezing Line Clues
- Radar, Satellite, and Winter Storm Warnings
- Snow Day Clues Parents Should Watch Overnight
- Common Mistakes When Reading Winter Weather Maps
- Conclusion
- FAQs
Winter weather can turn an ordinary school night into a suspenseful waiting game. Students hope for a day off, parents check their phones every few minutes, and school administrators monitor road conditions, buses, wind chills, and forecast updates. The big question is simple: will tomorrow be a snow day?
A snow day decision depends on many factors, but one of the most useful skills is knowing how to read a weather map. Weather maps show the movement of storms, cold air, precipitation, pressure systems, and hazardous conditions. They do not guarantee a school closure, but they can reveal important clues long before the official announcement.
For a quick estimate based on local conditions, you can also try the Free Snow Day Calculator. It can help you understand the likelihood of school closing when paired with your own weather-map reading skills.
Why Weather Maps Matter Before a Possible Snow Day
Weather apps often simplify the forecast into icons: a snowflake, a cloud, a percentage, or a temperature. While helpful, these icons do not explain the full weather setup. A weather map gives you a wider view of what is happening across your region.
For example, your phone may say “60% chance of snow,” but a weather map can show whether the snow is part of a fast-moving clipper system, a slow coastal storm, a lake-effect snow band, or a messy mix of sleet and freezing rain. Each setup affects school closures differently.
Snow day clues usually come from a combination of factors:
Storm Track
The storm track shows where the center of low pressure is expected to move. A small shift in the storm track can change snow into rain, rain into freezing rain, or light snow into heavy accumulation.
Timing
Snow that falls overnight or during the morning commute is more likely to disrupt school than snow that begins after dismissal. Weather maps with hourly radar and forecast timing are especially important.
Temperature Profile
Surface temperature matters, but the air above the ground also matters. A shallow layer of cold air can cause freezing rain. A deep layer of cold air supports snow. A warm layer aloft can cause sleet or mixed precipitation.
Road Conditions
Even a few inches of snow can create hazardous roads if it falls quickly, combines with wind, or begins before road crews can treat streets. Ice often causes more school closures than fluffy snow because it affects buses, sidewalks, and parking lots.
How to Read a Weather Map for Snow Day Clues Step by Step
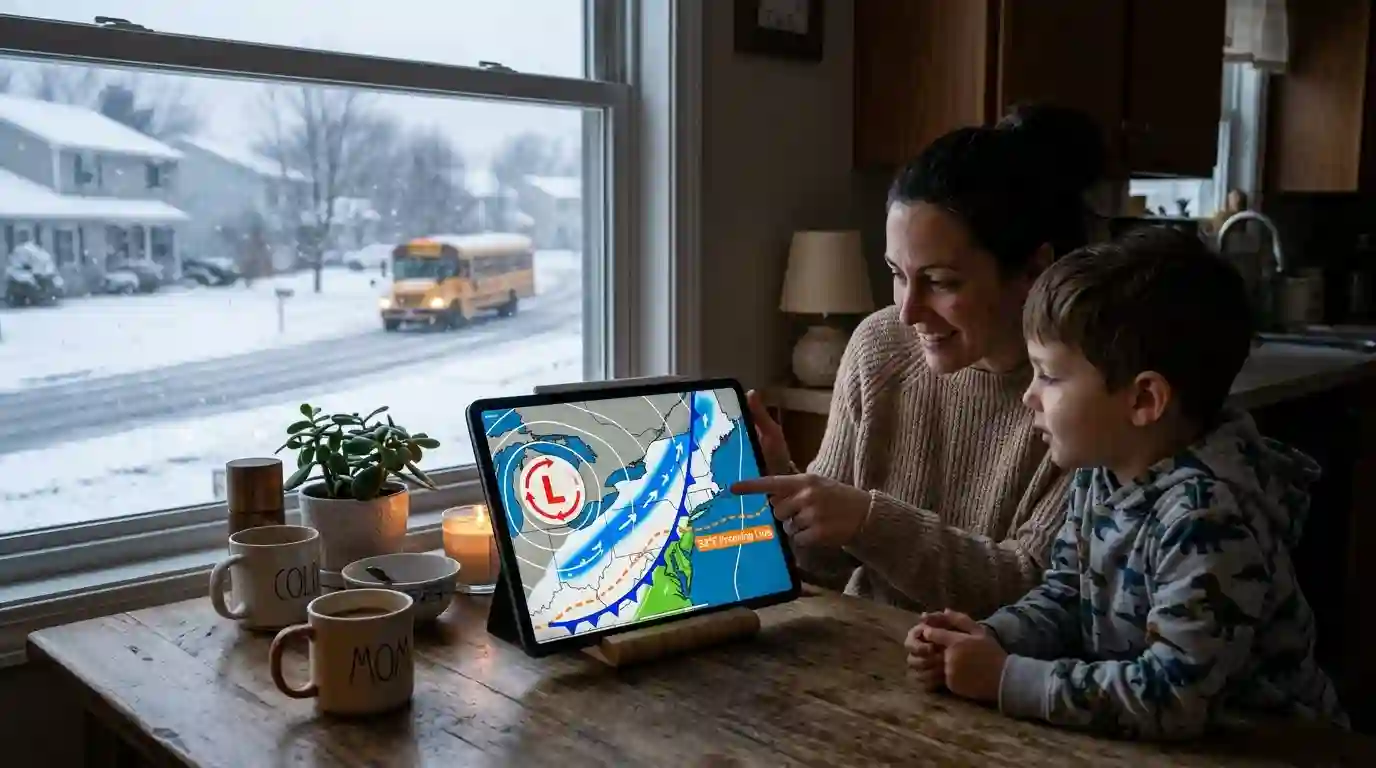
To read a winter weather map, start with the big picture and then zoom in. Do not focus only on the snow total map. Snowfall forecasts can change quickly, especially when the storm is still developing.
Step 1: Find the Low Pressure System
On most weather maps, a low pressure system is marked with an “L.” Low pressure often brings clouds, precipitation, and stormy weather. In winter, a strong low pressure system can pull moisture into cold air and create snow.
If the “L” is tracking south or east of your location, your area may be on the colder side of the storm. That can increase the chance of snow. If the low tracks west of your location, warmer air may move in and turn snow into rain or a wintry mix.
Step 2: Look for Fronts
Fronts are boundaries between air masses. A cold front can bring a quick burst of snow or a sharp drop in temperature. A warm front can bring overrunning precipitation, where warmer moist air rises over cold air at the surface. This setup can produce snow, sleet, or freezing rain.
A stationary front is especially important because it can keep precipitation over the same area for a long time. If temperatures are below freezing, a stationary boundary can lead to prolonged snow or ice.
Step 3: Check the Freezing Line
The freezing line, often shown as 32°F or 0°C, is one of the most important snow day clues. Areas north or west of the freezing line are more likely to see snow or ice. Areas south or east may see rain, depending on elevation and the upper-air pattern.
However, the freezing line at the surface is not the whole story. If warm air exists above a cold surface layer, freezing rain may occur. That is why maps showing precipitation type are useful.
Step 4: Watch the Precipitation Shield
The precipitation shield is the broad area of rain, snow, sleet, or freezing rain around a storm. If the shield is expanding toward your area and temperatures are cold enough, snow may begin earlier than expected.
Look for colors that represent snow, mixed precipitation, or freezing rain. Different weather services use different color schemes, but snow is often shown in blue, rain in green, mixed precipitation in pink or purple, and freezing rain in darker pink or magenta.
Step 5: Compare Forecast Models
One map is not enough. Meteorologists compare several forecast models, such as the GFS, NAM, HRRR, ECMWF, and regional high-resolution models. If multiple models show the same snow band, confidence increases. If models disagree, the forecast is less certain.
For families, the key is not to become a professional meteorologist overnight. Instead, look for agreement: do several reliable forecasts show snow at the same time, in the same area, with similar temperatures?
Understanding High and Low Pressure Systems
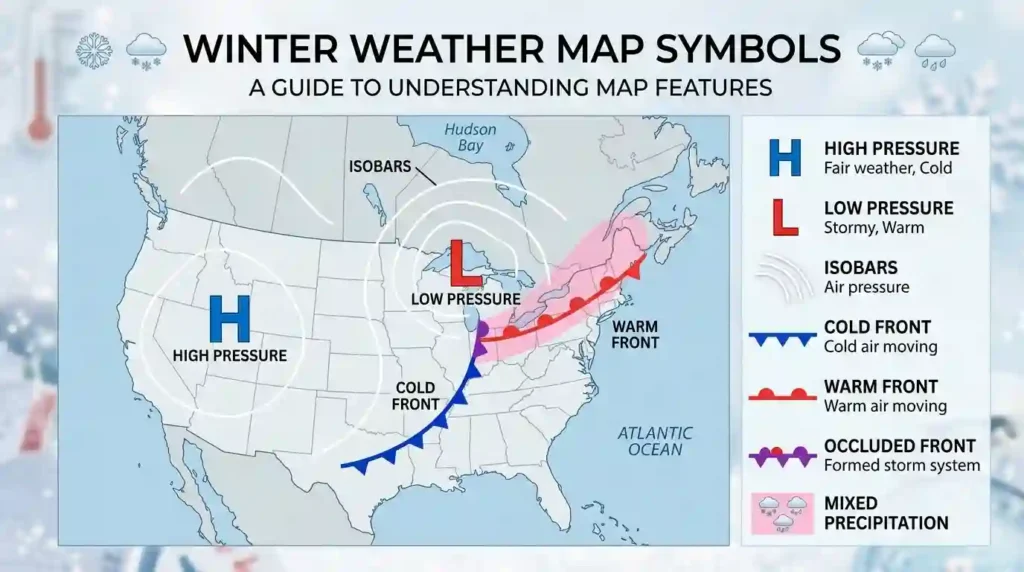
Pressure systems are the engines behind many winter storms. A blue “H” usually means high pressure, while a red “L” usually means low pressure. High pressure often brings calmer, colder, and drier weather. Low pressure often brings clouds, wind, and precipitation.
For a deeper explanation of common weather-map symbols, NOAA’s weather map guide is a helpful educational resource: NOAA guide to reading weather maps.
Low Pressure and Snow
A low pressure system can create rising air. Rising air cools, moisture condenses, and clouds form. If temperatures are cold enough, precipitation falls as snow. Strong low pressure systems can also create heavy snow bands, gusty winds, and blowing snow.
The location of the low matters. In many regions, a storm passing just south of your area can be ideal for snow because it keeps cold air in place while pulling moisture northward.
High Pressure and Cold Air
High pressure is not always boring. In winter, high pressure can supply the cold air needed for snow or ice. If cold high pressure sits to the north while a storm approaches from the south, the result can be a classic winter storm setup.
This is especially important for freezing rain. Cold air may remain trapped near the surface while warmer air moves overhead. Roads, sidewalks, trees, and power lines can become icy even when the air a few thousand feet above the ground is warmer.
Reading Cold Fronts, Warm Fronts, and Stationary Fronts
Fronts are among the easiest weather-map symbols to recognize, and they are packed with snow day clues.
Cold Front
A cold front is usually shown as a blue line with triangles. The triangles point in the direction the cold air is moving. In winter, a cold front can bring a sudden temperature drop, gusty winds, snow squalls, or a rain-to-snow changeover.
Snow squalls are short but intense bursts of snow. They may not produce huge snow totals, but they can cause dangerous travel because visibility drops quickly and roads can freeze fast.
Warm Front
A warm front is usually shown as a red line with half circles. In winter, warm fronts can be tricky. They may begin with snow, then change to sleet, freezing rain, and eventually rain if warm air wins.
If your school district is on the cold side of a warm front, watch carefully. Snow or ice may arrive before the warmer air reaches the surface.
Stationary Front
A stationary front is a boundary that barely moves. This can be a major snow day clue because precipitation may train over the same area for hours. If your town sits under a stationary front with below-freezing temperatures, snow or ice could accumulate steadily.
Occluded Front
An occluded front forms when a cold front catches up to a warm front. On weather maps, it is often shown as a purple line with triangles and half circles. Occluded storms can be mature systems with widespread precipitation, wind, and colder air wrapping around the low.
How to Read a Weather Map for Snow Day Clues Using Snow Bands
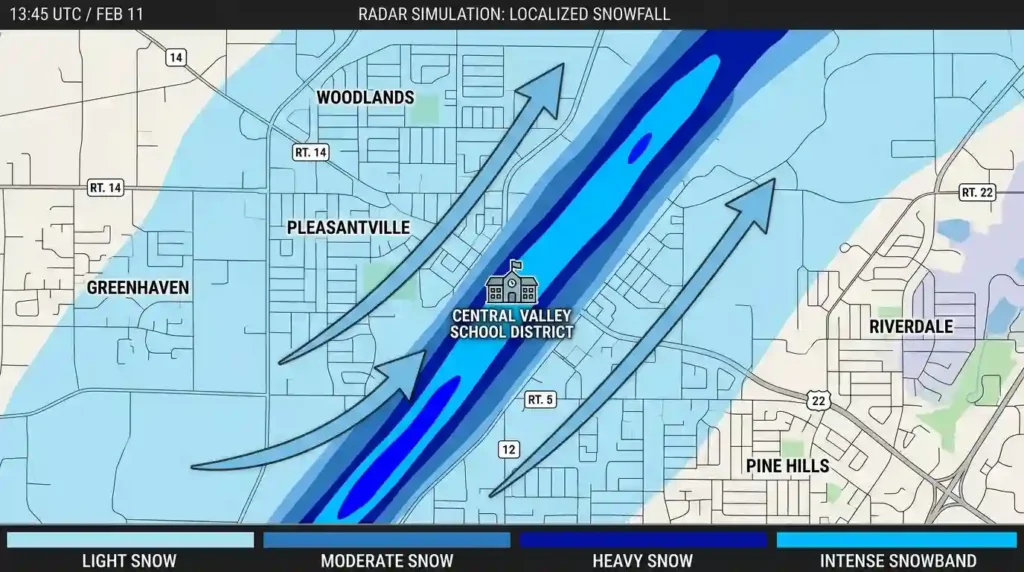
Snow bands are narrow zones of heavier snowfall. They can make the difference between a light dusting and a serious school-closing event. Two towns only 20 miles apart may receive very different snowfall totals if one sits under a persistent band.
What Snow Bands Look Like
On radar, snow bands often appear as narrow strips of darker blue or brighter colors within a larger snow shield. On forecast maps, they may show up as localized areas of higher snowfall totals.
Why Snow Bands Matter
A general forecast might call for 2 to 4 inches across a region, but a snow band could produce 6 inches or more in a smaller area. If that band sets up during the morning commute, schools may delay or close even if the regional forecast looked moderate.
Lake-Effect Snow Bands
In areas near the Great Lakes or other large bodies of water, lake-effect snow can be intense and localized. Cold air moving over warmer water picks up moisture, then drops heavy snow downwind. Weather maps may show long, narrow bands extending inland.
Lake-effect snow is hard to judge from a basic app icon. Radar loops, wind direction, and local advisories are much more useful.
Temperature, Dew Point, and Freezing Line Clues
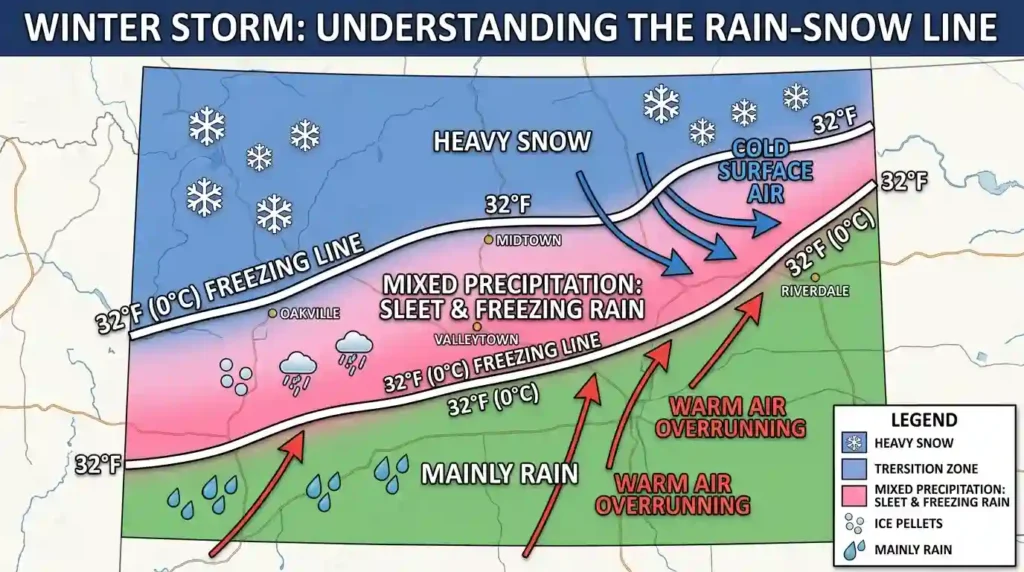
Snow is not just about whether the air temperature is below 32°F. A few degrees can make a major difference, but moisture and vertical temperature layers also matter.
Surface Temperature
If the surface temperature is below freezing, snow and ice are more likely to stick. If roads are already cold from previous nights, snow can accumulate faster. If the ground is warm, light snow may melt at first.
Dew Point
The dew point shows how much moisture is in the air. When precipitation begins, evaporative cooling can lower the temperature toward the dew point. That means an area that starts slightly above freezing may cool enough for snow once precipitation begins.
Wet-Bulb Temperature
Wet-bulb temperature is a useful winter weather clue. It estimates how cool the air can become through evaporation. If the wet-bulb temperature is below freezing, snow or ice may occur even if the current air temperature is slightly above 32°F.
The Rain-Snow Line
The rain-snow line is one of the most watched features on winter weather maps. If the line shifts north, snow may change to rain. If it shifts south, more areas may see snow. School closure chances often rise when the rain-snow line stays south of your district for several hours.
Radar, Satellite, and Winter Storm Warnings
Weather maps are even more useful when you combine them with radar, satellite images, and official alerts.
Radar Loops
A radar loop shows precipitation movement over time. Instead of looking at a single radar image, watch the loop for direction, speed, and intensity. Ask yourself:
Is the snow moving toward my area?
Is it intensifying or weakening?
Is the rain-snow line moving closer?
Are heavier bands forming nearby?
Will precipitation arrive before buses start running?
Satellite Images
Satellite images show cloud patterns and storm organization. A strong winter storm often has a large comma-shaped cloud shield. While satellite images may be harder for beginners, they can show whether a storm is strengthening.
Winter Weather Advisories and Warnings
Official weather alerts are major school closure clues. A winter weather advisory may indicate travel problems, while a winter storm warning suggests more serious conditions. Ice storm warnings, blizzard warnings, and wind chill warnings can also affect school decisions.
Remember, a school district may close even if snow totals are not extreme. Dangerous wind chills, icy sidewalks, poor visibility, and unsafe rural roads can all influence the decision.
Snow Day Clues Parents Should Watch Overnight
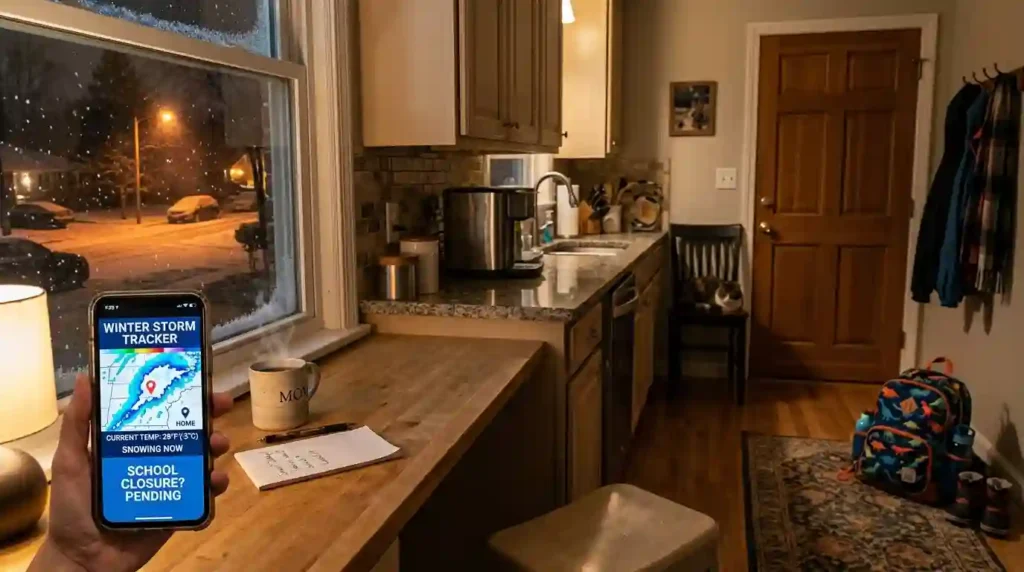
Many school closure decisions happen early in the morning. If you are checking weather maps the night before, focus on timing and confidence.
Before Bed
Look at the latest forecast map, radar, and local National Weather Service alert. If snow is already approaching and temperatures are below freezing, closure chances may increase.
Around Midnight
If you are awake, check whether precipitation started earlier than expected. Early arrival gives snow more time to accumulate before morning.
Early Morning
This is when road conditions matter most. A map may show only a few inches of snow, but if snow is falling heavily during bus pickup, districts may delay or close.
Communication With Kids
Snow days can be exciting, but sudden schedule changes may confuse younger children. Parents can prepare simple explanations ahead of time. For guidance, read How to Talk to Young Kids About Why School Is Closed.
Common Mistakes When Reading Winter Weather Maps
Weather maps are helpful, but they can be misunderstood. Avoid these common mistakes when looking for snow day clues.
Mistake 1: Trusting One Snowfall Map Too Early
Snowfall maps often change. A map posted three days before a storm may look dramatic, but the final track can shift. Use early maps for awareness, not certainty.
Mistake 2: Ignoring Ice
Many people focus only on snow totals. Freezing rain and sleet can be more dangerous for school transportation. Even a thin glaze of ice can create hazardous roads and sidewalks.
Mistake 3: Looking Only at Your Town
Weather systems move. Look upstream to see what is coming from the west, southwest, south, or coast, depending on your region. Radar trends outside your town can reveal what may arrive next.
Mistake 4: Forgetting Elevation
Higher elevations often receive more snow and colder temperatures. A nearby valley may see rain while hills or mountains get accumulating snow.
Mistake 5: Ignoring Local School Policies
Some districts close quickly because buses travel rural roads. Others remain open unless conditions are severe. Weather maps show hazards, but school decisions also depend on transportation, staffing, sidewalks, building access, and local safety standards.
Conclusion
Reading a weather map is one of the best ways to understand whether a snow day might happen. Instead of relying only on a snowflake icon or a single snowfall number, look at the full winter weather setup. Find the low pressure system, track the fronts, watch the freezing line, compare radar loops, and pay close attention to timing.
The strongest snow day clues usually appear when cold air is already in place, moisture is moving in, snow or ice is expected before the morning commute, and official alerts mention hazardous travel. Snowfall totals matter, but road safety, ice, wind, visibility, and school transportation routes matter just as much.
When you combine weather-map skills with local forecasts and tools like the Free Snow Day Calculator, you can make a smarter guess about whether school might be delayed or closed. The final decision always belongs to the school district, but understanding the map helps you see the clues before the announcement arrives.
FAQs
What is the most important weather map clue for a snow day?
The most important clue is the combination of precipitation timing and freezing temperatures. Snow or ice arriving overnight or during the morning commute is more likely to affect school schedules than snow arriving later in the day.
Does a low pressure system always mean snow?
No. Low pressure often brings precipitation, but the type depends on temperature. If the air is cold enough, precipitation may fall as snow. If warm air moves in, it may fall as rain, sleet, or freezing rain.
What does the 32°F line mean on a weather map?
The 32°F line shows where surface temperatures are near freezing. Areas on the colder side are more likely to see snow or ice, but upper-air temperatures also matter.
Why can one town get a snow day while another nearby town does not?
Snow bands, elevation, road conditions, and local school policies can vary over short distances. One town may receive heavy snow while another gets only light accumulation.
Is freezing rain worse than snow for school travel?
Often, yes. Freezing rain can create a thin layer of ice on roads, sidewalks, buses, and parking lots. Even small amounts of ice can be dangerous.
How early should I check a weather map before a possible snow day?
Start checking 24 to 48 hours before the storm, but pay the closest attention the night before and early in the morning. Winter forecasts can change quickly.
Can radar help predict a school closure?
Radar can help you see whether snow or ice is approaching, how fast it is moving, and whether heavy bands are forming. It does not predict school closures directly, but it gives useful real-time clues.
Are snowfall maps always accurate?
No. Snowfall maps are forecasts, not guarantees. They can change as the storm track, temperature, and precipitation intensity change.
What does a cold front mean for snow?
A cold front can bring colder air, gusty winds, and sometimes snow showers or snow squalls. If moisture is available, snow may develop as the front passes.
Should parents rely only on weather apps for snow day predictions?
Weather apps are useful, but parents should also check weather maps, radar, official alerts, and school district messages. A complete picture is better than one app icon.